Better Performance: VMware®’s Suggestions for Identifying Proper Workload Configuration on vSAN Performance Testbed
Delving Deeper into the Initial Baseline Testing Configuration
As mentioned in my blog titled “Definitive Best Practices: Inside Western Digital’s vSAN Performance Testbed,” I designed my first HCIBench configuration around this Storage Review All-Flash vSAN 6.2 Article. This enabled me to have apples-to-apples comparisons with readily available industry data. I have worked with Storage Review many times in the past; I knew they were a fount of knowledge and could help me if I got stuck deploying an unfamiliar benchmark.
Delving deeper into the Storage Review article, you’ll notice the following HCIBench configuration outline:
- 16 VMs
- 10 VMDKs per VM
- 10GB VMDK (1.6TB footprint)
- 50GB VMDK (8TB footprint)
- 100GB VMDK (16TB footprint)
- Full-write storage initialization
- 5-hour test intervals (30-minute preconditioning, 60-minute test sample period)
For my initial testing, I emulated this configuration exactly; however, I chose to run only the 1.6TB and 16TB footprints.
As for specific workloads to test, Storage Review is considerate enough to provide workload profiles for most of their tests. This provides transparency and allows others in the industry to emulate their work. In this case, they provided 5 workload profiles:
- 4KB random, 100% read
- 4KB random, 100% write
- 8KB random, 70% read / 30% write
- 32KB sequential, 100% read
- 32KB sequential, 100% write
With the assistance of the other Technologists in the Data Propulsion LabsTM, I chose to add these additional workloads (block sizes of 64KB and up provide insight into when one can expect to reach maximum throughput):
- 64KB random, 95% read / 5% write – Recommended by the DPL Oracle® Technologist
- 64KB random, 100% read
- 64KB random, 100% write
- 256KB random, 100% read
- 256KB random, 100% write
- 512KB random, 100% read
- 512KB random, 100% write
- 1MB random, 100% read
- 1MB random, 100% write
I looked at the workloads to run, which now totaled 14, and decided to run each one only three times. Why only 3? Because 14 tests * 1.5 hrs. each = 21 hrs., so that’s 21 hrs. for a single, full run-through. Once you add the 30-60 minutes required for storage initialization and then add the time it takes to drain the write cache between runs, it’s ~24 hrs. to complete a single run of all workloads. That translates into 72 hrs. of my cluster running full-out before I have a base minimum set of numbers to average and compare.
Please note that while I have not used this blog as an opportunity to do a step-by-step HCIBench tutorial, I selected “Clear Read/Write Cache Before Each Testing” and set “Initialize Storage Before Testing” to “ZERO”.
As I didn’t want to introduce delays, I used the information shared in Chen Wei’s blog titled “Use HCIBench Like a Pro – Part 2” to bypass the web interface and fully script the test initialization, using a combination of PowerShell™ and VMware Power CLI™. This allowed me to kick off the tests and return three days later to analyze the results.
To more easily share the HCIBench configuration, here is a copy of the perf-conf.yaml file that I used for this testing.
vc: 'dplvc6u5-rtm.usdpl.datapropulsionlabs.com'

vc_username: 'administrator@usdpl.datapropulsionlabs.com'

vc_password: '############'

datacenter_name: 'vDPL'

cluster_name: 'PerfTestBed'

network_name: 'DPL-LAB'

dhcp_enabled: false

reuse_vm: true

datastore_name:

- 'vsanTestBed'

deploy_on_hosts: false

hosts:

host_username: 'root'

host_password: '############'

easy_run: false

clear_cache: true

number_vm: 16

number_data_disk: 10

size_data_disk: 10

self_defined_param_file_path: '/opt/automation/vdbench-param-files'

output_path: 'SS200-1.6T-BL'

warm_up_disk_before_testing: 'ZERO'

testing_duration:

cleanup_vm: false
VMware’s Feedback and Suggestions for Workload Configuration on vSAN
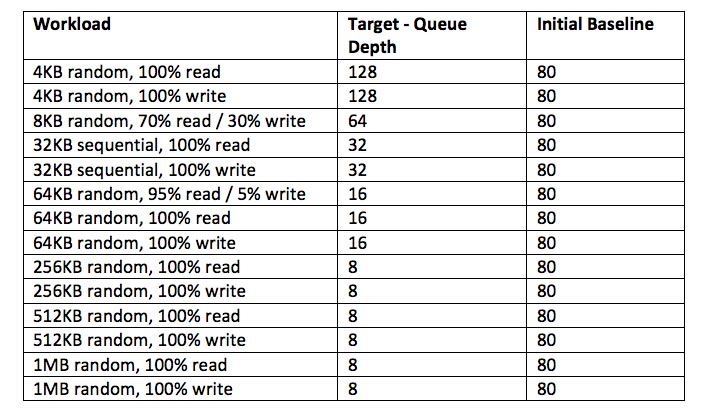
After running a series of tests, I approached Chen Wei and other performance engineers at VMware with two simple questions about the results: “Is this all I should expect?” and “What can I do better?” Their response was enthusiastic and quite prompt. The first suggestion was that disabling Checksum could provide some performance advantages, but in return reiterated their reasoning for having checksum enabled by default. Checksum is enabled by default to provide a data integrity mechanism to ensure no errors make it through from the underlying storage devices. This means that disabling Object Checksum in a production environment should be considered only if: a) the application provides its own data integrity mechanism; or b) you are not concerned with the ability of the underlying storage medium to maintain data integrity. They also explained that with the plethora of hardware options available to vSAN, each individual vSAN would have its own sweet spot for synthetic testing. They suggested I “draw a line in the sand” and then increase or decrease workloads from that line, until I located the appropriate HCIBench configuration for best performance on my Testbed. With that in mind and with my experience with synthetic testing, I decided to target these Queue Depths per host:
This information is all well and good, but how do we apply it? Let’s look first at my original baseline configuration. As it was based on Storage Review’s configuration, I had 16 VMs with 10 VMDKs each. That means I had a total of 160 VMDKs spread across a 4-node cluster.
Looking at one of the workload files, we find that I have 2 threads assigned to each VMDK under test. Below is the config file for a 4KB random, 100%-read workload. The two threads per disk remained consistent throughout all workload configuration files in the initial baseline.
*example workload: Single run, 10 raw disk


*SD:  Storage Definition

*WD:  Workload Definition

*RD:  Run Definition

*

sd=sd1,lun=/dev/sdb,openflags=o_direct,hitarea=0,range=(0,100),threads=2

sd=sd2,lun=/dev/sdc,openflags=o_direct,hitarea=0,range=(0,100),threads=2

sd=sd3,lun=/dev/sdd,openflags=o_direct,hitarea=0,range=(0,100),threads=2

sd=sd4,lun=/dev/sde,openflags=o_direct,hitarea=0,range=(0,100),threads=2

sd=sd5,lun=/dev/sdf,openflags=o_direct,hitarea=0,range=(0,100),threads=2

sd=sd6,lun=/dev/sdg,openflags=o_direct,hitarea=0,range=(0,100),threads=2

sd=sd7,lun=/dev/sdh,openflags=o_direct,hitarea=0,range=(0,100),threads=2

sd=sd8,lun=/dev/sdi,openflags=o_direct,hitarea=0,range=(0,100),threads=2

sd=sd9,lun=/dev/sdj,openflags=o_direct,hitarea=0,range=(0,100),threads=2

sd=sd10,lun=/dev/sda,openflags=o_direct,hitarea=0,range=(0,100),threads=2

wd=wd1,sd=(sd1,sd2,sd3,sd4,sd5,sd6,sd7,sd8,sd9,sd10),xfersize=(4096,100),rdpct=100,seekpct=100

rd=run1,wd=wd1,iorate=max,elapsed=3600,warmup=1800


* 10 raw disks, 100% random, 100% read of 4k blocks at unlimited rate
Now let’s consider Total Effective Queue Depth per host. With 160 total VMDKs, I had a total of 320 threads working across the cluster, or 80 threads per host. As the distinction between queue depth and threads is blurry for VDBench—which is the underlying benchmark in HCIBench—we land at 80 for the Total Effective Queue Depth per host, for all workloads in the initial baseline.
This table summarizes workloads, queue depths, and baselines.
This meant that for all the initial baseline tests I needed to reconfigure my workload configuration on vSAN to match the target Total Effective Queue Depth per host.
Modifying the Initial Baseline Configuration to Align with Target Queue Depth per Host
As I considered VMware’s suggested testing methodology for identifying the optimal workload configuration on vSAN, I decided to take a fresh look at the initial configuration. I discarded the apples-to-apples comparison approach, and I integrated my own preferences for configuring storage benchmarks. Here are the actions that I took:
- Whether dealing with a physical or virtual machine, I am a firm believer in always adding storage in numbers that represent the powers of 2. I reduced the VMDK count per VM from 10 to 8.
- Since most workloads were well over the target queue depths per host, I reduced the number of VMs from 16 to 8.
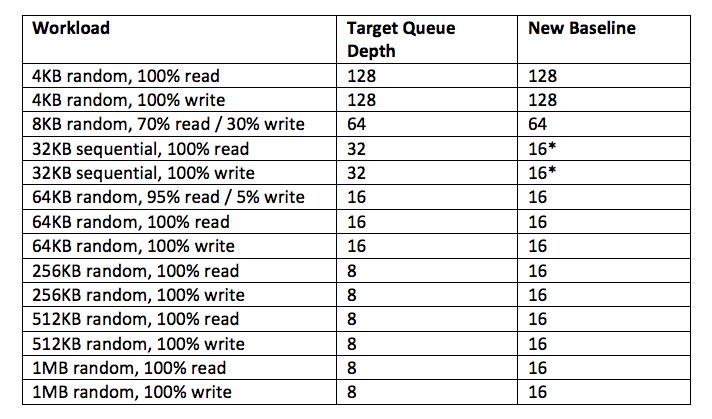
- I then customized each workload file to better match the target queue depth per host. As I had 8 VMs with 8 VMDKs each, it was impossible to reach the initial line in the sand of 8 for Total Effective Queue Depth per host.
With 8 VMs and 8 VMDKs each, I had a minimum of 64 threads across the cluster, or a minimum of 16 threads on a per-node basis. This left the HCIBench configuration as follows:
- While writing this blog, I found that I had deviated from original plan for the 32KB block size queue depth. However, the results are still spectacular.
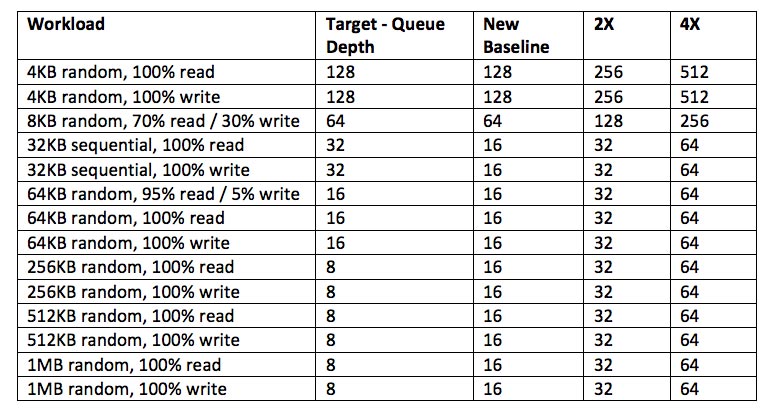
Also, as suggested by VMware, I implemented a small queue depth sweep with 2x and 4x the target queue depth per host, to identify the appropriate configuration for my solution. The consistently better performance was found at the 4x initial line in the sand.
I hope this better clarifies the testing procedure and lays a better foundation for those interested, as we move ahead to additional blogs.
Up Next: Western Digital’s vSAN Performance Testbed: Exploring Performance Tuning Parameters.


