Building the Supply Chain of the Future
Global supply chains are reaching new levels of scale and complexity, with customer requirements rapidly evolving. This makes a one-size-fits-all fulfillment model at best, inefficient, and at worst, downright confusing. Instead, we saw an opportunity to take advantage of our end-to-end visibility, connected enterprise systems, and data modeling to create a customer-centric, micro supply chain. In 2017, we made the bold decision to build this supply chain of the future.
Using data science techniques along with a rich set of historical supply chain data, we created a machine learning feedback loop to help automate supply chain modeling. Powered by a customer rules engine, the model self-adjusts as customer requirements change. In the end, we built and validated a prediction model that is more reliable than carrier committed dates – enabling us to drive transit times, routes, and shipping schedules down to the delivery-address level. Here’s how we did it.
Building a Cross-Functional Team
It was important for us to bring together multiple perspectives from cross-functional teams. This way, we could distribute the workload and get the most out of each group’s talents. We sought to be highly collaborative and brought together groups across three different departments to form our data science “super” team.
- Digital Analytics Office – focused on data science and innovation
- Strategic Applications – focused on digital architecture and integration
- Logistics Center of Excellence – focused on business intelligence and innovation
Together, we were able to design smarter data science solutions from the ground up that worked within our existing enterprise application ecosystem.
Setting a Strategic Framework and Approach
After putting our team together, the next step was to layout our supply chain optimization strategy. We set up a framework that consisted of four pillars:
- Foundation: connected enterprise systems, big data infrastructure, visualization and analytics
- Network Landscape: optimizing and streamlining our carbon footprint, rationalizing carrier base, and network modeling
- Team and Organization: created a control tower, center of excellence, developed our talent, focused on culture, and managed change
- Digital Solutions: emerging tech, intelligent transportation, machine learning, smart warehouse, adaptive network, RPA
We wanted to make sure not to be too rigid or flexible. Instead, we took a balanced, bi-modal approach to create our Adaptive Fulfillment Model. Our Control Tower used “continuous improvement” to move the needle using standardized tools in a predictable, standard process. At the same time, our Center of Excellence practiced “continuous innovation” to make progress by using disruptive, highly adaptive methods – innovating along the way and learning to fail quickly. Together, using these methods enabled us to mature our technology quickly, efficiently, and cost-effectively.
In this way, we moved from simply managing and connecting business operations and systems to using predictive analytics with machine learning. Down the road, artificial intelligence could enable prescriptive analytics that simulates and optimize business capabilities.
Defining a Digital Ecosystem
Before we could create our Adaptive Fulfillment model, we needed to build a data lake. Our company delivers tens of thousands of shipments every week to enterprise data centers, channel partners and more. To do this, we ingested data from our integrated systems including transportation management, workload management, and freight forwarders. Once we built the data lake, we used it to feed directly into our data model and analytics platform. Our model analyzed shipping routes and calculated the best days to ship. With these insights, we were able to use our transportation management system to improve reliability, speed up transit time for inventory, and increase shipment consolidation.
Phase 1 – The Beginning
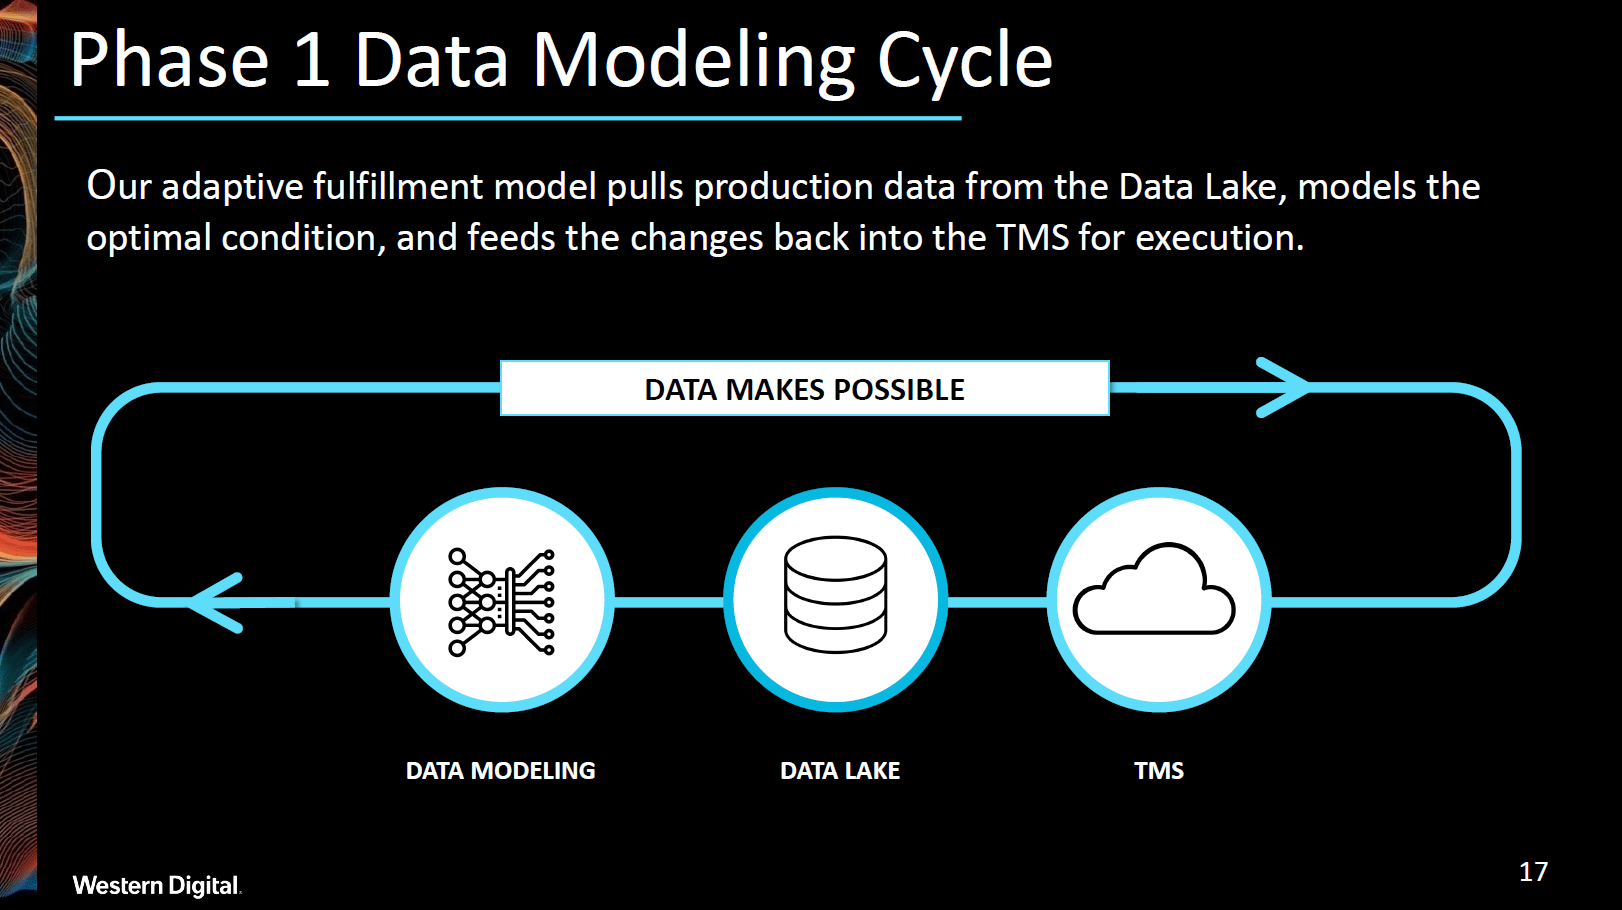
Phase 1 was all about setting up our Adaptive Fulfillment Model and getting it off the ground. Our team kept everything relatively simple and straightforward: data flowed from our transportation management system through our data lake to our data model in a closed loop. By implementing this system, we saw a substantial increase in reliability and shipment consolidation – all while decreasing cost. At the same time, we made a couple of key observations:
- Data cleansing is critical to achieving the most effective results.
- The model needs to run in an ongoing loop to detect changes in the network.
- “Time in Transit” needs to be added as a metric to track shipping route optimization.
Phase 2 – Observations and Improvement
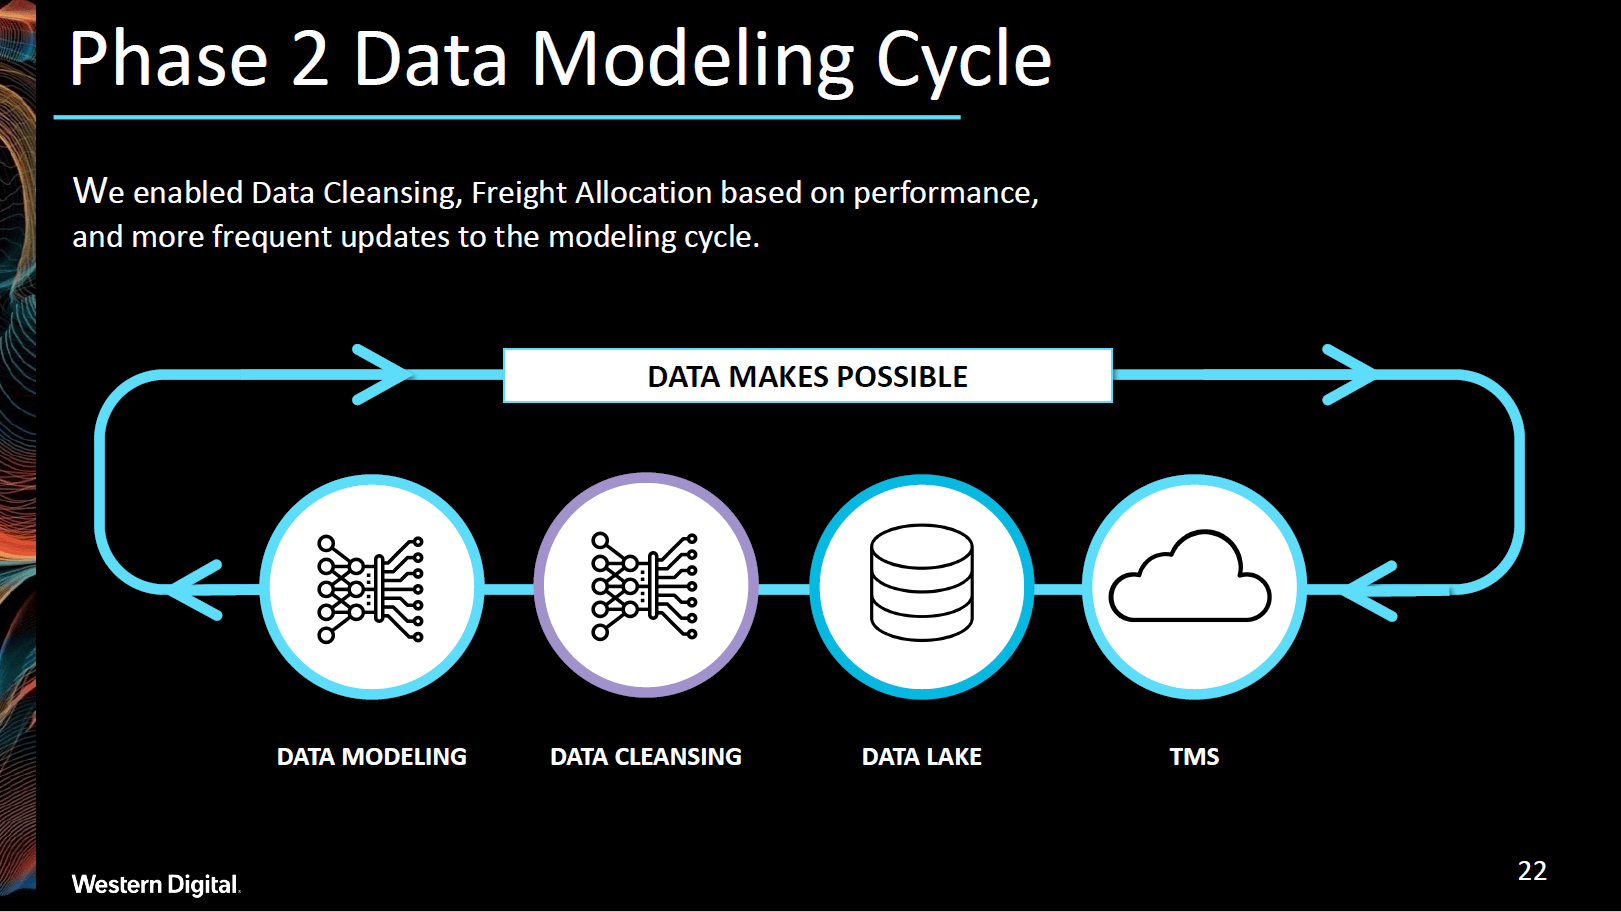
In Phase 2, we started to get more sophisticated in our data analysis. Our team developed ways to automatically “flag” issues in our master and cleanse the data prior to modeling. We were even able to drill down deeper to correlate unique shipping routes to reliability and model volume allocation to freight forwarders based on their performance. Thanks to optimized routes, we were able to significantly cut down on time in transit. In addition, we made sure to incorporate more frequent updates to the modeling cycle, compared to Phase 1. Putting this updated machine learning loop into practice, we made a few takeaways:
- A digital twin is needed to run multiple models.
- Connecting with IoT and supply chain disruption data can drive further business value.
- “Carbon Footprint” needs to be added as a metric to track our reduction in emissions.
Phase 3 – Future Plans
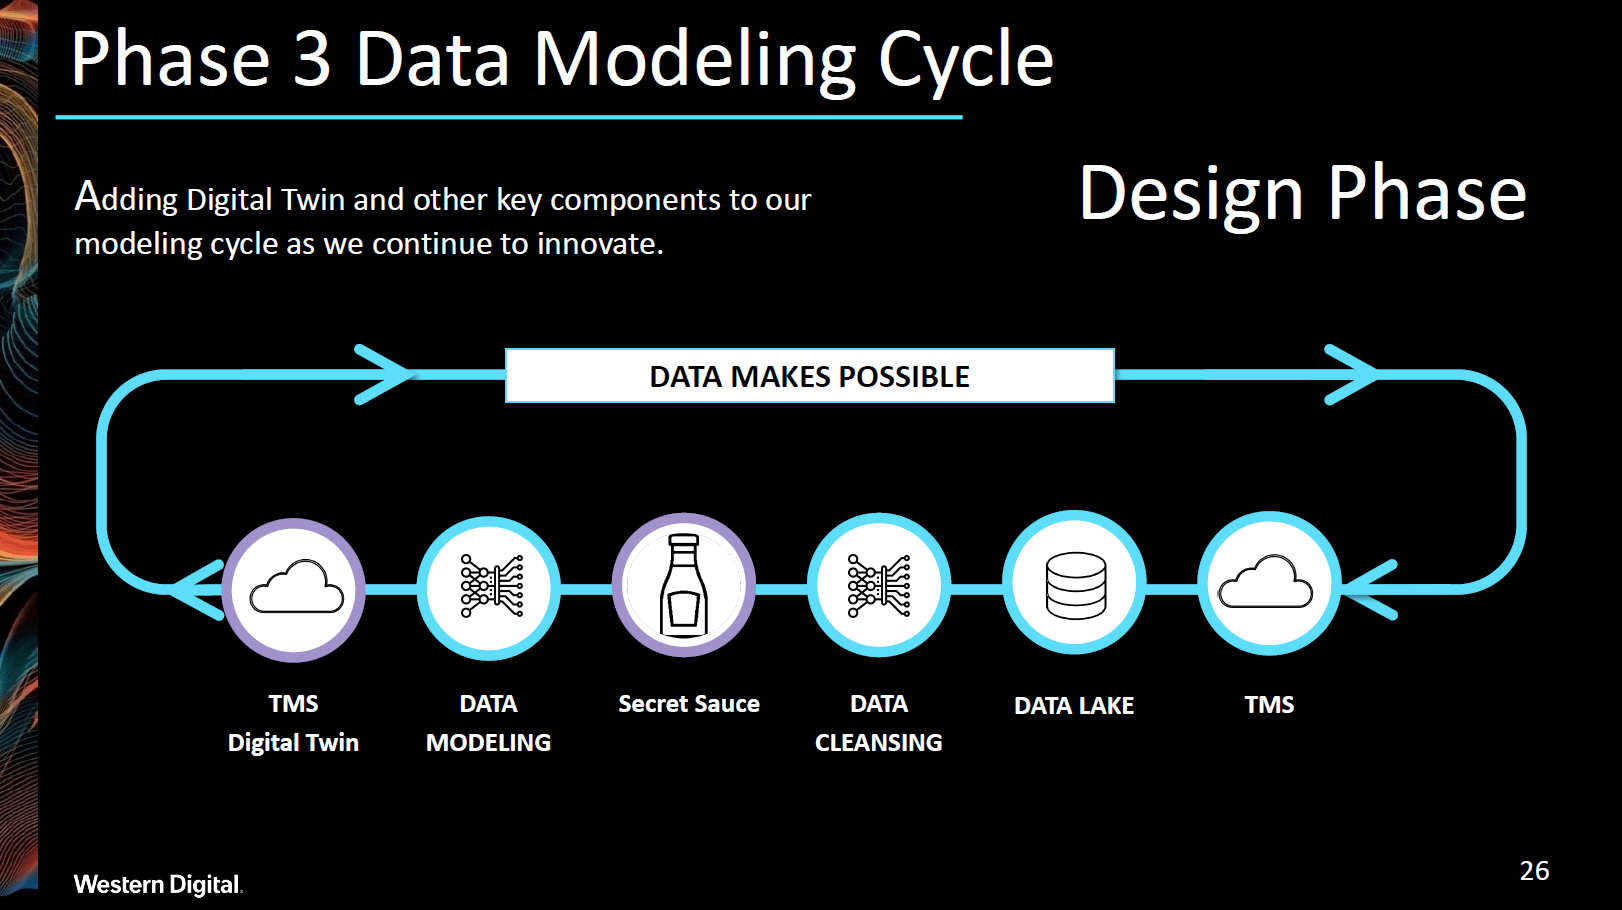
With our lessons learned from the previous two rapid learning cycles, our third phase was about taking the supply chain to the next level. We introduced a digital twin to run multiple machine learning model comparisons. Also, we put in place an optimization algorithm, which we will leave to your imagination, to further improve our data modeling. Our results were fed directly into enterprise planning systems for the best inventory output results and warehouse capacity balancing. Last, but not least, we were able to measure our reduction in carbon footprint thanks to consolidating shipments.
The Proof is in the Data
We wanted to be sure we were carefully measuring quantifiable results for our Adaptive Fulfillment Model iterations. Overall, we experienced big improvements in several key areas of our supply chain.
- 21.8% increase in shipment consolidation
- 21.7% improvement in reliability
- 20.4% decrease in time in transit
- 6.7% reduction in cost
The first big gain was a 21.8% increase in shipment consolidation. By cutting down on the number of shipments, we reduce our carbon footprint, which has a meaningful impact on the environment. Additionally, reliability in our supply chain rose by 21.7%. We gain greater trust from our customers and improve our brand’s perception by consistently delivering against our commitments. Another area that saw growth was the time in transit, which decreased by 20.4%. Our model optimized shipping routes and delivered shipments to our customers more quickly. Together, this progress in reliability, shipment consolidation and time in transit cut costs by 6.7%.
The Future of Our Future Supply Chain
We harnessed rich historical data to define the most effective, and forward-looking model that continues to self-refine in an automated fashion with safeguards and business controls. Moving forward, we will continue to look at fine-tuning our Adaptive Fulfillment Model with new data parameters. We are actively working to develop and deploy a digital twin for forward-looking modeling, which will enable us to compare different scenarios, understand potential outcomes, and push the most effective alternative into production. Finally, by using IoT-enabled devices and airline routes, we can further optimize route planning and collect supply chain data about shipments in-transit.
Learn More
- Find out why smart factories welcome the wave of industry 4.0
- Learn how the industry 4.0 transition means architecting for AI, ML, and IoT


