
The media & entertainment workflow is becoming increasingly complex. New digital formats, collaborative tools, and data-intensive applications have changed everything from the creation, to the editing, manipulation and transmission of digital media assets. Data repositories are overflowing and they’re spanning geographical locations, platforms and clouds. This makes data management nearly impossible and studios and production houses need to find a way to get a complete picture of their data. That’s where abstraction comes in.
But you might be asking,
What is abstraction?
The Rise of Abstraction
As noted in my earlier blog and during our recent webinar, abstraction is a new approach to data management that separates content from its metadata so you can view all projects’ data in a unified way regardless of storage medium, location, or platform.
It is probably not surprising that the concept of abstraction was a hot topic at NAB a few weeks ago. Everyone wants to figure out how to work together easier, reduce the time from funding to release, and contend with managing extreme amounts of data.
Yet, abstraction is not only about creating a seamless data environment, it’s also about enabling critical insight for decision-making. Breaking down the siloes of data means that teams can visualize the workflow – resources consumption – and cost, ensuring that they are able to make decisions efficiently and automate processes.
From Abstraction to Visualization — 3 Critical Steps
Abstraction can paint a clear picture of your content and assets, infrastructure requirements, and their ongoing costs. Yet moving from abstraction to being able to visualize data for insight is a multi-step process.
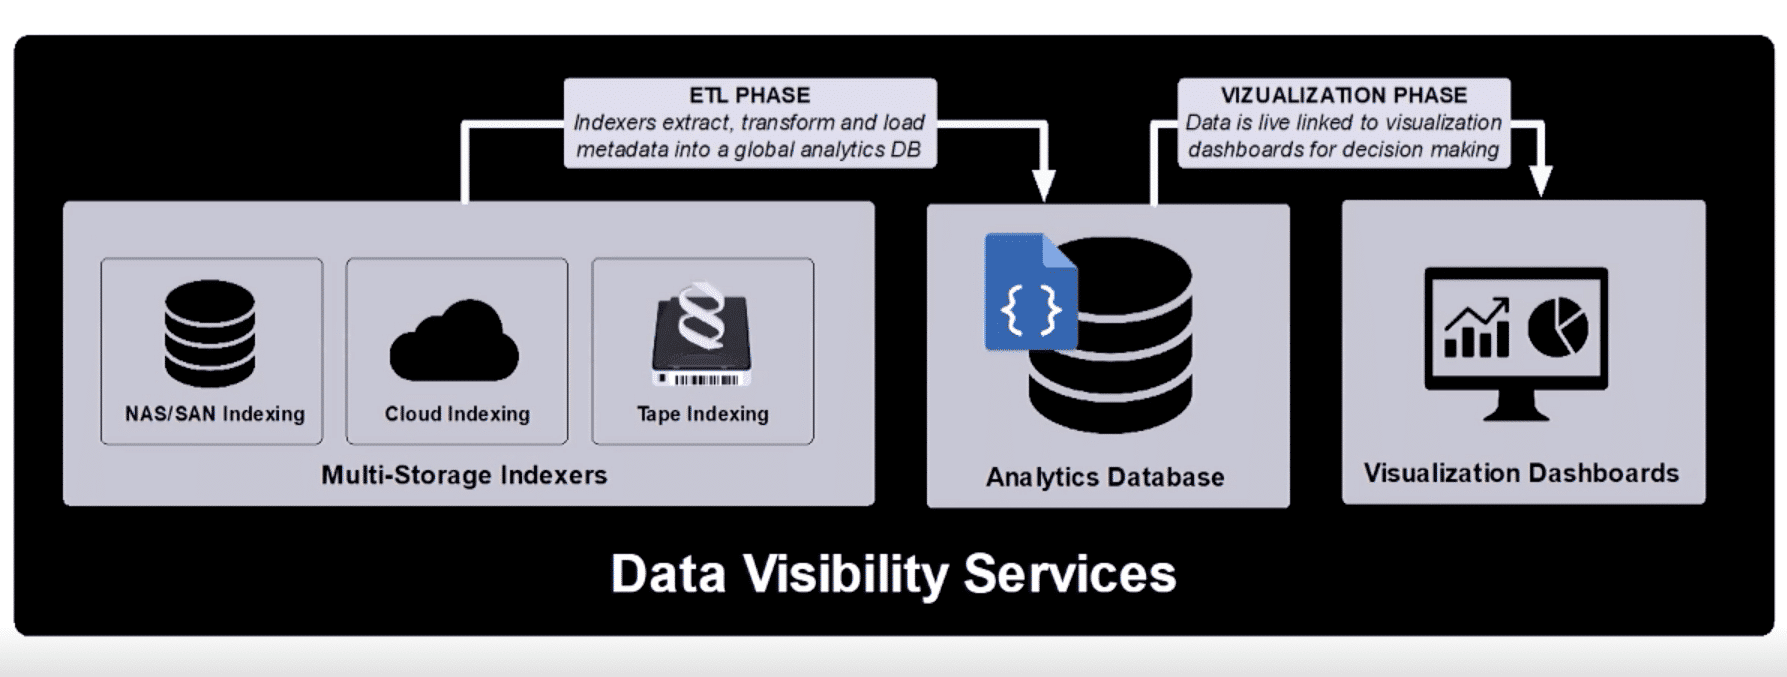
As mentioned by StorageDNA CEO Tridib Chakravarty (tC) during a recent webinar (part 2), there are three key steps in moving from abstraction to visualization:
- Extraction: Pulling all data from various locations, platforms, clouds, and devices
- Transformation: Adding appropriate tags to the data that has been extracted to begin the transformation from unstructured to structured; and
- Loading: Taking all of the now structured data and loading it into a global analytics database, which can then lead to visualization via platforms like Tableau
Each step is imperative in turning disparate massive repositories with data in potentially hundreds of different formats into a structured pane, thus helping you to better understanding what data is meaningful in the workflow and what’s just eating up resources.
DNAfabric – data visibility and mobility
When the data is no longer siloed and you add structure even to the unstructured, teams can capture clear insight into the holes or overlapping content, and instead of arbitrarily increasing storage, they can scale and align resources accordingly.
Time is Money
Making sense of the content across various platforms and formats is a game-changer for media & entertainment. At the end of the day, “time is money,” and for the media & entertainment industry, when decision making becomes easier and faster, they can more quickly move content from ingest to distribution.
Check out part two of our webinar showing how to move from abstraction to visualization.