Don’t put a Go Kart engine in your race car! Part II of this blog series looks at initial testing results and how they can help you to choose the right Storage Spaces Direct configuration for virtualized workloads.
Software-defined storage solutions can provide many benefits, but they can’t overcome running a workload on the wrong storage configuration. In my first post in this series, Matching Storage Spaces Direct Configurations to Your Workload, I introduced workloads and I/O patterns in the context of Storage Spaces Direct.
In this post I will look at some early test results and what they suggest for configuring all-flash Storage Spaces Direct for virtualized workloads.
The Test Environment – All-Flash Using SAS and NVMe™ SSDs
Let’s spend a moment describing what was tested.
Hardware: a 4-node Storage Spaces Direct cluster using Lenovo™ x3650 M5 servers, with Mellanox® ConnectX®-4 100Gb/s NICs (to ensure network bandwidth wasn’t a bottleneck).
Software: each node ran Windows Server® 2016 Datacenter Edition with Storage Spaces Direct enabled, and the DiskSpd storage performance test tool creating I/O load. Altogether there were 4 instances of DiskSpd running, one on each node, running bare-metal (no virtualization).
The storage configuration was tested by having DiskSpd run about 400 combinations of varying block size, read/write mix, queue depth, working set size, etc. The four DiskSpd instances are coordinated so they run the identical combination at the same time, and when that combination has completed they move together to the next combination. A total of several petabytes of I/O were issued, with about 1 billion rows of data captured (PerfMon counters, event logs, etc.) for later analysis.
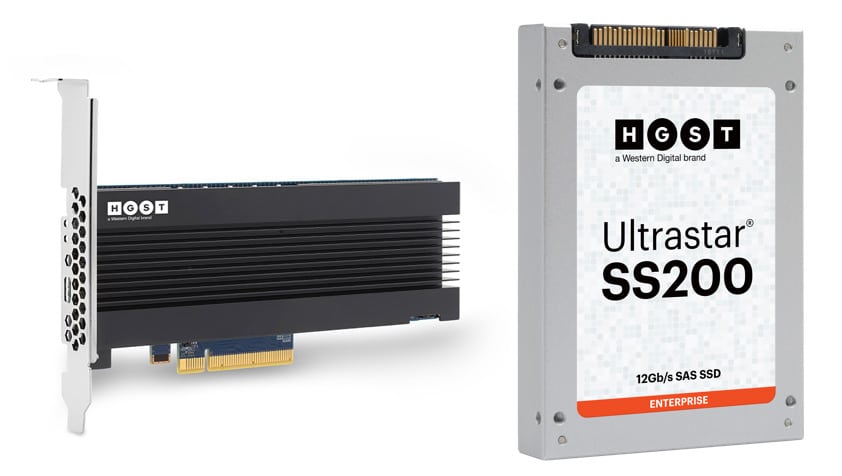
This configuration used the HGST Ultrastar® SN260 NVMe Add-In Card (AIC) SSD for the caching tier, and the HGST Ultrastar SS200 12G SAS SSD for the capacity tier.

For testing, each node had one NVMe drive (3.2TB)[1] and 10 SAS SSDs (each 1.92TB) – note this is not a recommended production configuration (and I’ll explain further in my next blog), but was adequate for testing and provides relevant insights. This configuration gave 22.4TB of raw storage per nodes, and 89.6TB across the cluster.
Test Results – 100K’s of IOPS, at Microsecond Latency
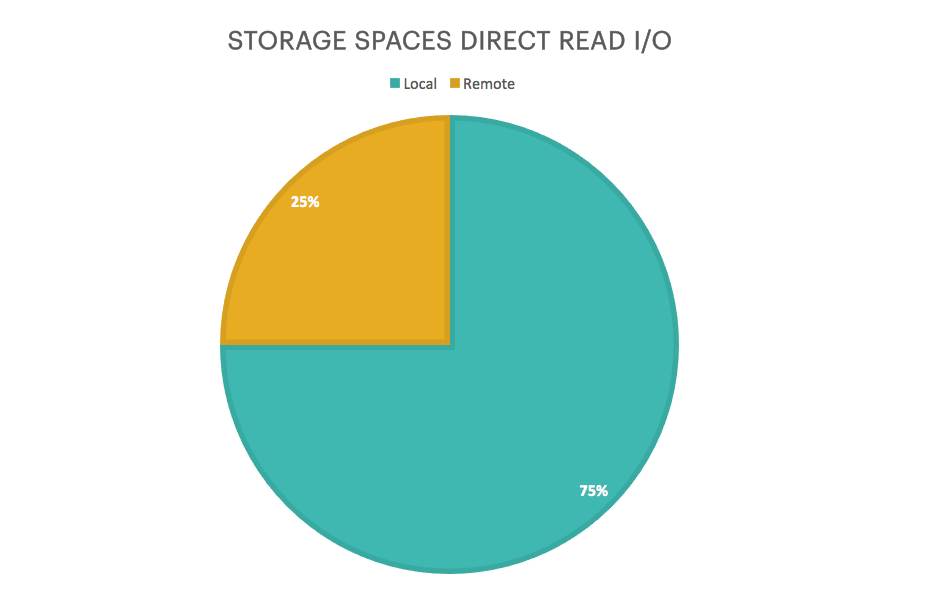
We observed that 75% of reads came from the local node, i.e., from the storage devices directly attached to the server; the other 25% of reads came from a different node in the cluster using SMB RDMA.

This makes sense intuitively: Storage Spaces Direct was configured to use 3-way mirroring, you have your original data, call it A, plus two extra copies of your data, call them A’ and A”, so three copies total. Storage Spaces Direct decides which node gets each of those copies.
In our 4-node configuration, you get a copy on the local node – whether A, A’ or A” – in three of the four permutations of which node gets which copy, and no local copy in the remaining permutation. So it stands to reason that 75% of reads came from the local node, and 25% of reads came from a remote node.
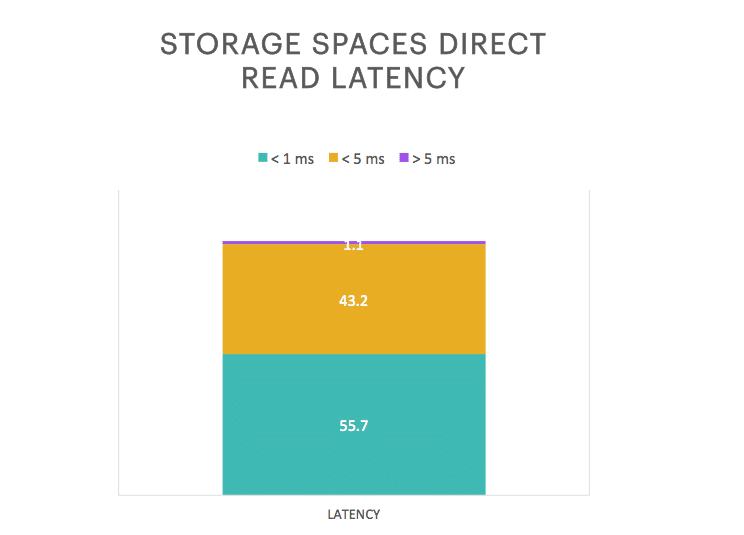
Looking at local and non-local reads together, we observed that 98.9% of all reads completed in <5 ms, with 55.7% completed in <1 ms and 43.2% completed in <5 ms (measured over 176k IOPS @ 64kB, 100% random read).

This is one of the key value propositions for Storage Spaces Direct, high performance delivered by standard hardware. Ask your SAN admin what percentage of requests to the SAN are completed in <5ms, and ask your reseller to compare the cost of a Storage Spaces Direct solution to that SAN.
Good For Virtualization
The test results suggest this all-flash configuration should be a good fit for virtualized workloads, by enabling increased workload density, i.e., more workloads running on each node.
Caution! Just as this test did not use a production configuration of Storage Spaces Direct, this test also did not use virtualization – each DiskSpd instance ran natively on its storage node, without Hyper-V.
Why does that matter? Based on the test results I infer, rather than measure and report, what the implications are for virtualized workloads.
For example, a Hyper-V host typically runs more than the one workload we tested with. More workloads means more threads issuing I/O requests and waiting for I/O completion, more I/O request queued up for processing (higher queue depth), more contention at the drive level, and longer waits for I/O completion (higher latency).
How much will of all that impact performance, latency, and workload density? Great question! To respond quantitatively, we must test, measure and report – something to look forward to, another day.
Why? By default, Storage Spaces Direct reads directly from the SSD capacity tier devices (i.e., read caching is disabled), because SSDs naturally deliver high read performance; and writes first go to the NVMe SSD cache device to take advantage of their much higher write performance. Storage Spaces Direct automatically consolidates data written to the NVMe cache – i.e., two writes to adjacent blocks will be consolidate into one write of two blocks – and destages it to the SAS SSD capacity tier as needed.
In our test configuration, Storage Spaces Direct can take advantage of each Ultrastar SS200 SAS SSD delivering 250,000 read IOPS at 100 μs latency (4k random reads), and the Ultrastar SN260 NVMe SSD delivering 200,000 write IOPS at 20 μs latency (512B random writes).
| Performance per-device | IOPS | Latency |
| Cache – Ultrastar SN260 NVMe SSD | 1,200,000 write (4kB RW) | 20 μs (512B RW) |
| Capacity – Ultrastar SS200 SAS SSD | 250,000 read (4kB RR) | 100 μs (4kB RR) |
Summary of per-device performance
This storage configuration enables Storage Spaces Direct to exploit the read performance of several SAS SSDs, and the write performance of the NVMe SSD, to support a host with high workload density – exactly what you want from a virtualized host.
We can say with confidence that Storage Spaces Direct takes advantage of the capabilities of today’s SSDs to deliver a very high performance storage solution, at a very attractive price.
Summary – More Workloads on Fewer Hosts
Test results confirmed that an all-flash configuration of Storage Spaces Direct delivers very high performance and very low latency. We know that’s what you want from a hyperconverged infrastructure (HCI) system running virtualized workloads.
We also know from earlier testing that fast flash storage enables the same host to support more workloads, while accelerating workload performance; i.e., storage performance is the bottleneck for most systems. So we can expect an all-flash Storage Spaces Direct configuration will let you increase workload density – more workloads on fewer hosts; doing more with less.
Fewer hosts also means fewer software licenses. Since software licenses can be the majority of total system cost, consolidating to fewer hosts and needing fewer licenses, could result in dramatic savings.
Finally, we all know that every workload and execution environment is different, so don’t take my word for it! Test to confirm for yourself that the environment you plan to deploy will support the scale of virtualization you have planned.
In my next blog post I’ll focus on designing a Storage Spaces Direct configuration to support consolidating SQL Server OLTP workloads, and discuss in more detail how to size your caching and data tiers appropriately.
At Western Digital we create environments for data to thrive. I hope these blogs can help you choose the best configuration to unleash the power of data using Storage Spaces Direct.
Subscribe to our blog to get my next blog post to your inbox.
[1] One terabyte (TB) is equal to 1,000GB (one trillion bytes) when referring to solid-state capacity. Accessible capacity will vary from the stated capacity due to formatting and partitioning of the drive, the computer’s operating system, and other factors.


