As I am sure many of you are aware, Microsoft’s end of extended support for SQL Server® 2005 has come and gone. It has been a solid title and one I still see in production environments. Are you considering moving off 2005 or 2008 this year? “Modern Day Magic Beans: SQL Server® Consolidation using Hyper-V”, by my buddy Peter Plamondon can give you a great perspective at the impressive ROI many are achieving after migrating to the newer SQL Server titles. For those of you migrating, here are a few SQL Server migration tips to help you evaluate your next steps, and help determine what flash might be most advantageous to your environment.
Analyze Your Workload
Step one in readying for migration is to get an understanding of the characteristics of your current workload. All too often the performance delta between conventional rotational media and flash solid state storage masks poor architectures. These errors, while not readily apparent at start up, will amplify over time and scale.
Using load stress tools like DISKspd, you’ll be able to map the ceiling of the current architecture, but I would recommend going one step further and leveraging a tool like Dell’s DPACK (Dell Performance Analysis Collection Kit) to characterize the current demands your SQL Server environment is placing on your infrastructure.
DPACK is a great workload witnessing tool that I often use in my engagements. It allows for a scientific sizing of the current micro or macro environments in a format that is easy to process and understand. By comparing a series of reports it allows for intuitive identification of workload behaviors and data liquidity trends over time.
What You Should Measure
For the purposes of this blog we will concern ourselves with reporting around CPU, Memory Utilization, Latency, and Queue Depth. This is by no means the full extent of what the tool covers, but only a few key elements that we will be using here. I will use real-world examples I’ve taken from a standard Dell PowerEdge R730 system.
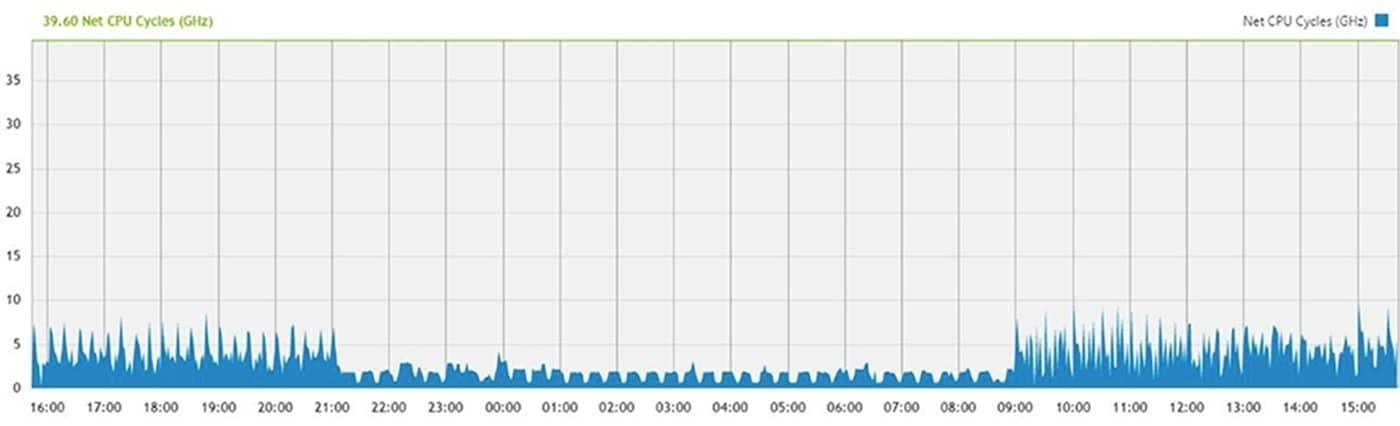
CPU
In the graph below, CPU cycles are shown across a time scale. We want to monitor large independent peaks or extended plateaus and correlate the timing of these with what is going on with the workload:
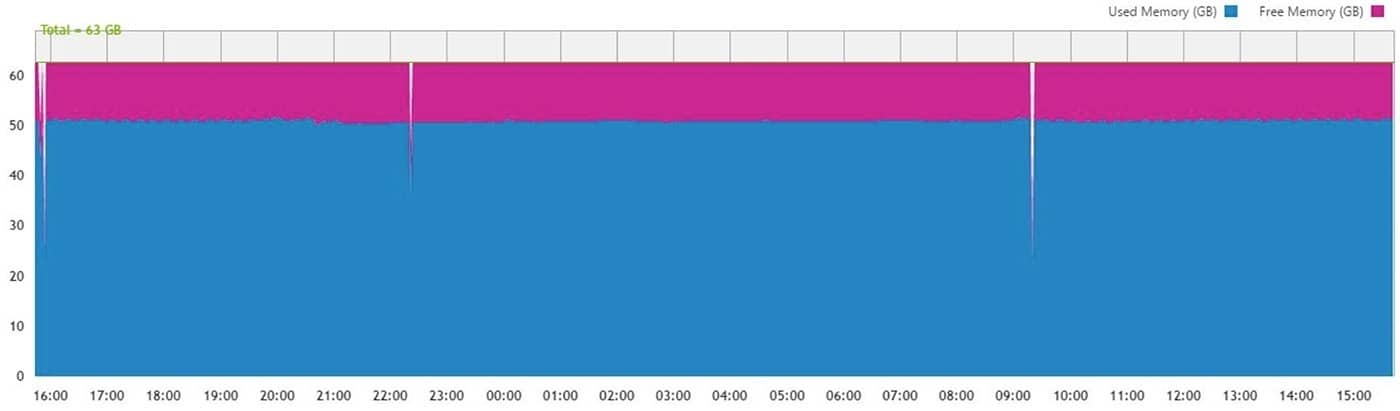
Memory Utilization
Memory Utilization is one of the more interesting sections to monitor especially as we move toward more heavily virtualized systems. Having a consistent reserve shows a disciplined architecture, but to get a good ROI we do want the memory footprint working for us and not sitting idle.
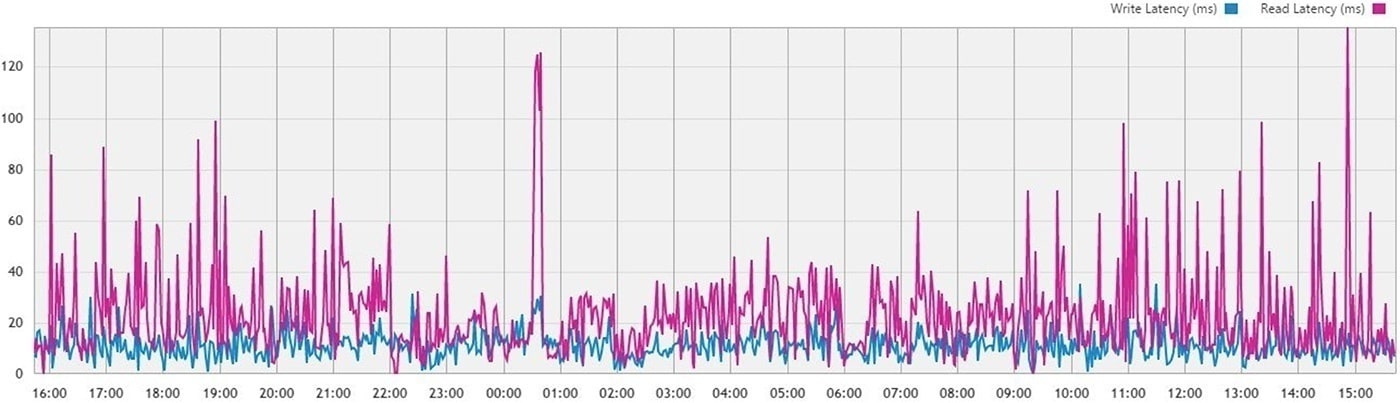
Latency
Latency is where we will see some of the most dramatic real-world impacts on contemporary workloads. Being broken down between read and write latencies, this area is a great window into troubleshooting underperforming environments.
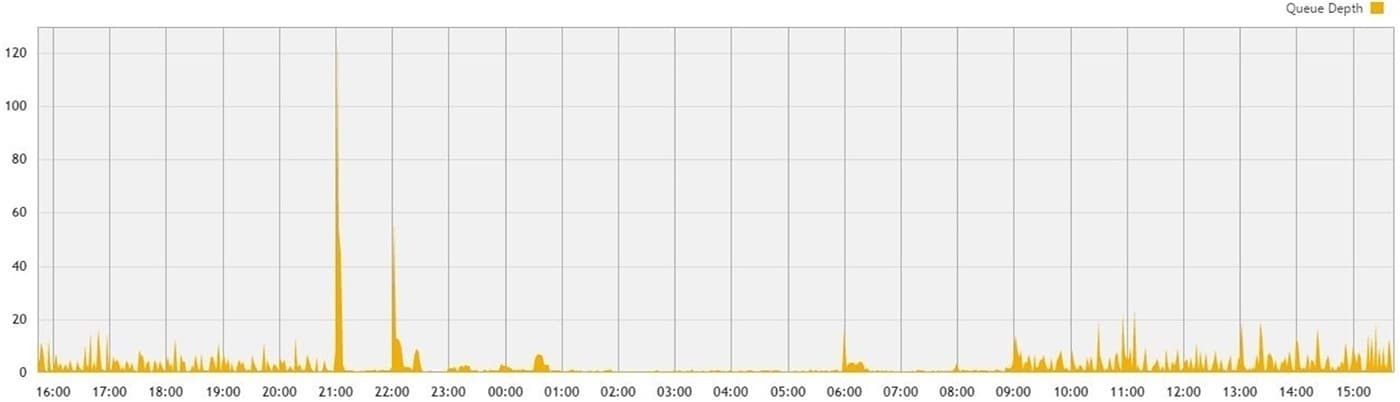
Queue Depth
Queue Depth peaks and valleys are fine, like the ones you see in the graph below. Where you’ll get into trouble is where we see sustained plateaus. These plateaus signal that the rest of the system is waiting on the underlying storage.
Armed with this dataset from DPACK, we can then decide what architectural performance gains we can leverage to adapt to the changing workload needs.
3 Performance Symptoms Flash Can Treat
Here are key performance symptoms that flash can treat:
1. Saturated Disk Queues and High Latency
Welcome to the number one performance hit I see most often. If this is your issue, you are likely spindle bound. Your tempDB allocation is the most likely culprit in this instance as the underlining storage is struggling to keep pace with your queries. This can be extremely detrimental to application performance in the case of cross-core queries, not to mention cross processor queries. Placing the tempDB on a higher-performing storage medium will improve performance in the same form factor. This issue can be solved by either caching the tempDB through products like our own FlashSoft® software or SanDisk DAS Cache used by Dell, or by migrating from HDD to SSDs or PCIe application accelerators like Fusion ioMemory™.
2. Low CPU Utilization vs High Memory Utilization
Leveraging tools such as DPACK you’ll want to identify high workload events where memory utilization is high but there is not a corresponding event in CPU utilization. Often at these times memory has been saturated and SQL Server has been forced to access data pages from the underlining storage repository. This can either be local to the host or down the pipe at the SAN. What does this mean for you? One of your most costly assets in the server is wasting idle cycles waiting on legacy drives to deliver the data. Leveraging SanDisk® flash at this tier can improve response times and can dramatically increase CPU utilization. Situations like these are also prime candidates for host-level caching. Again, SanDisk DAS Cache can be leveraged for local caching or if you are in a shared environment, FlashSoft software.
3. Ecosystem Saturation
Another result of memory saturation will be the secondary effects on neighboring application stacks seeking to utilize the SAN controllers. As many SAN architectures are moving to a flash-based architecture, undue stress is placed on these costly assets, while quality of service of the application ecosystem plummets. SAN caching through FlashSoft on the hosts or the DAAD appliance frees up the SAN to do what it was designed to do–write and protect data–while improving the performance of more than just the SQL Server workload.
One More Tip on Memory Utilization
Another key point to keep in mind going forward is that you want high memory utilization; otherwise you are wasting your investment in assets. Memory that is running hot with a corresponding latency event is where you need to reevaluate underlying architectures.
A Disciplined Approach
The primary benefit of this more disciplined approach to sizing is that we are making architecture decisions based on quantifiable data. We can make a very compelling case that application latencies are necessitating PCIe flash or SATA for example. By pinpointing where the main performance bottlenecks lie, we can also ensure the greatest performance gains and best ROI.
If you have any questions on what flash might be most advantageous to you environment, please leave a comment below.